CLIMATE CHANGE INFOGRAPHICS
<a href=/climate-inflation-resources/climate-crisis-is-at-the-gates-of-europe>Climate Crisis is at the gates of Europe</a>
<a href=/climate-inflation-resources/modeling migration patterns in the USA under sea level rise>U.S migration model - rising sea levels</a>
<a href=/climate-inflation-resources/climate-displacer-stats>If the trajectory of high greenhouse gas emissions and unequal development continues unchallenged, an average of 170 million people across six regions will be subjected to internal migration by 2050, according to Statista. </a>
<a href=/climate-inflation-resources/usa-eggflation-crisis>Over the past year, The average cost of a dozen Grade A large eggs reached a whopping $4.25 last month, compared to just $1.79 twelve months earlier, according to the U.S. Bureau of Labor Statistics. </a>
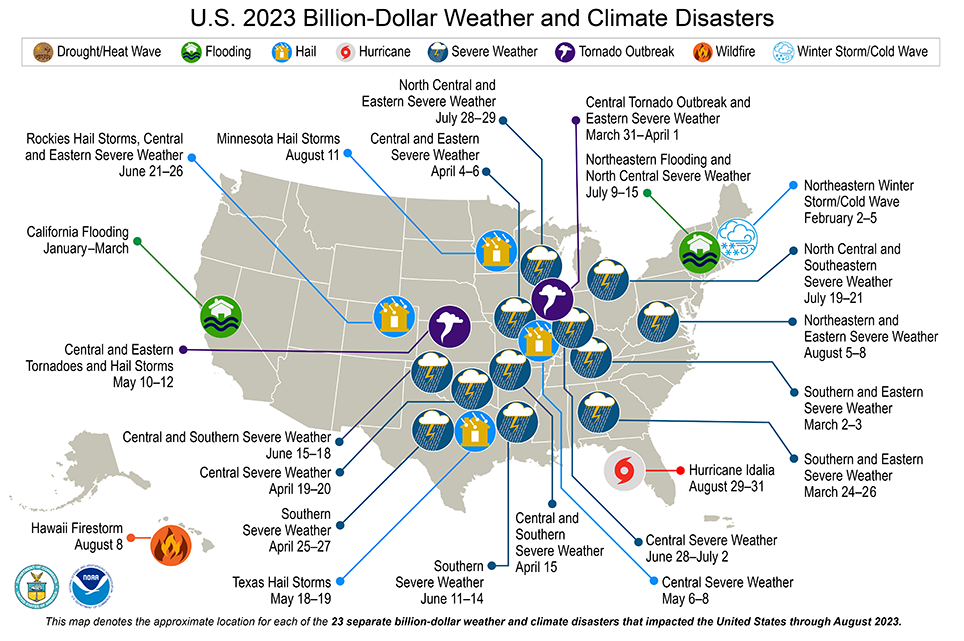
<a href=/climate-inflation-resources/billion-dollar-natural-disasters-across-the-usa-2023>In 2023, from Jan 1, to September 11, the United States has already witnessed 23 weather and climate disaster events, each causing losses exceeding $1 billion. </a>
<a href=/climate-inflation-resources/rising-frequency-and-costs-of-billion-dollar-natural-disasters-across-usa>Over the decades, the frequency of billion-dollar natural disasters has surged dramatically. </a>
<a href=/climate-inflation-resources/recorded-natural-disaster-events-1900-2022>Climate inflation, a long-standing economic phenomenon, is intensifying as a result of escalating natural disasters and the vulnerability of economies. This global issue carries a substantial economic burden, with weather-related catastrophes causing a staggering $268 billion in damages in 2020 and $329 billion in 2021.</a>
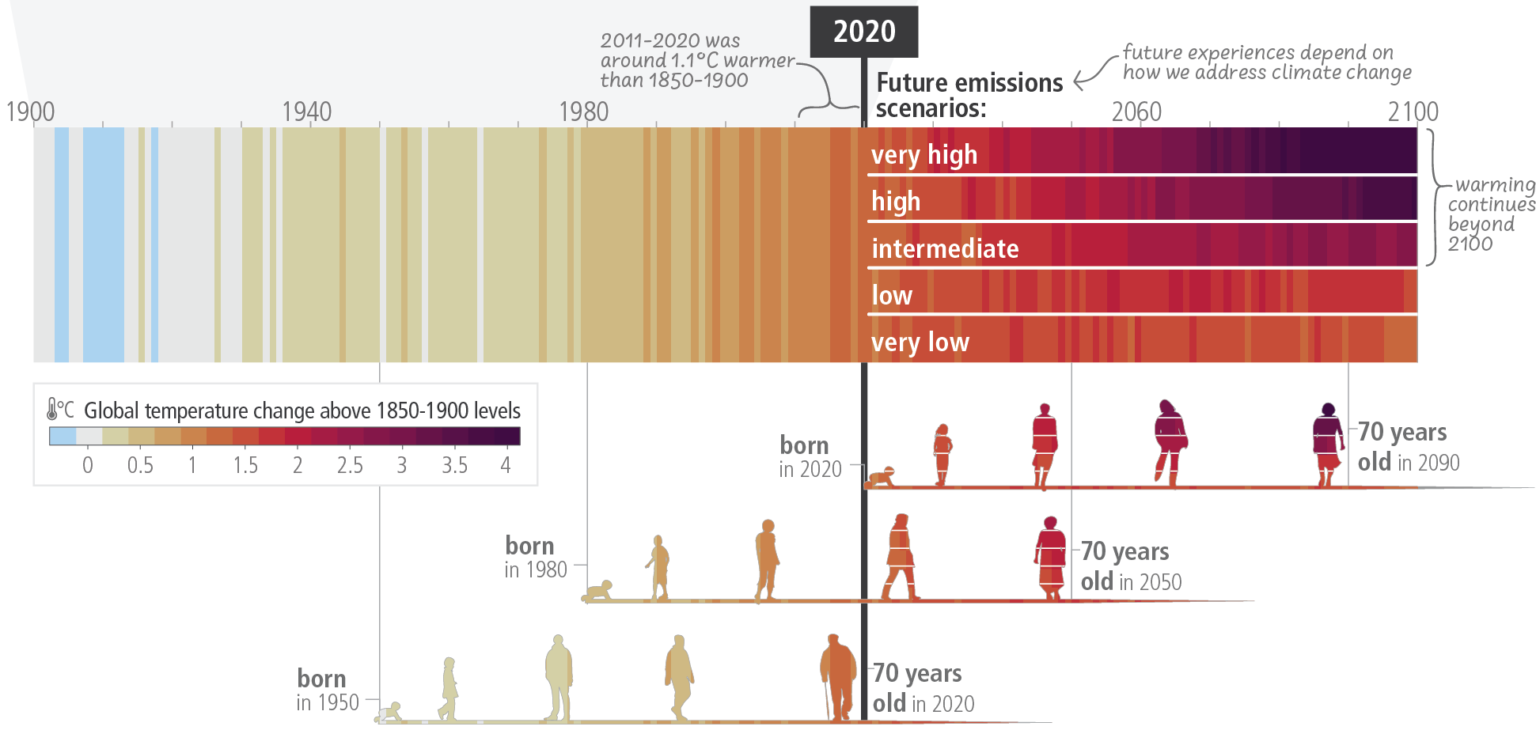
<a href=/climate-inflation-resources/climate-crisis-visualized-perils-for-future-generationsf7j56>Researchers at the University of Reading have pioneered a climate change visualization tool, providing a compelling glimpse into the challenges confronting future generations. By highlighting the potential consequences of inaction, the researchers hope to galvanize policymakers and individuals to intensify their efforts to reduce greenhouse gas emissions and mitigate global warming.</a>
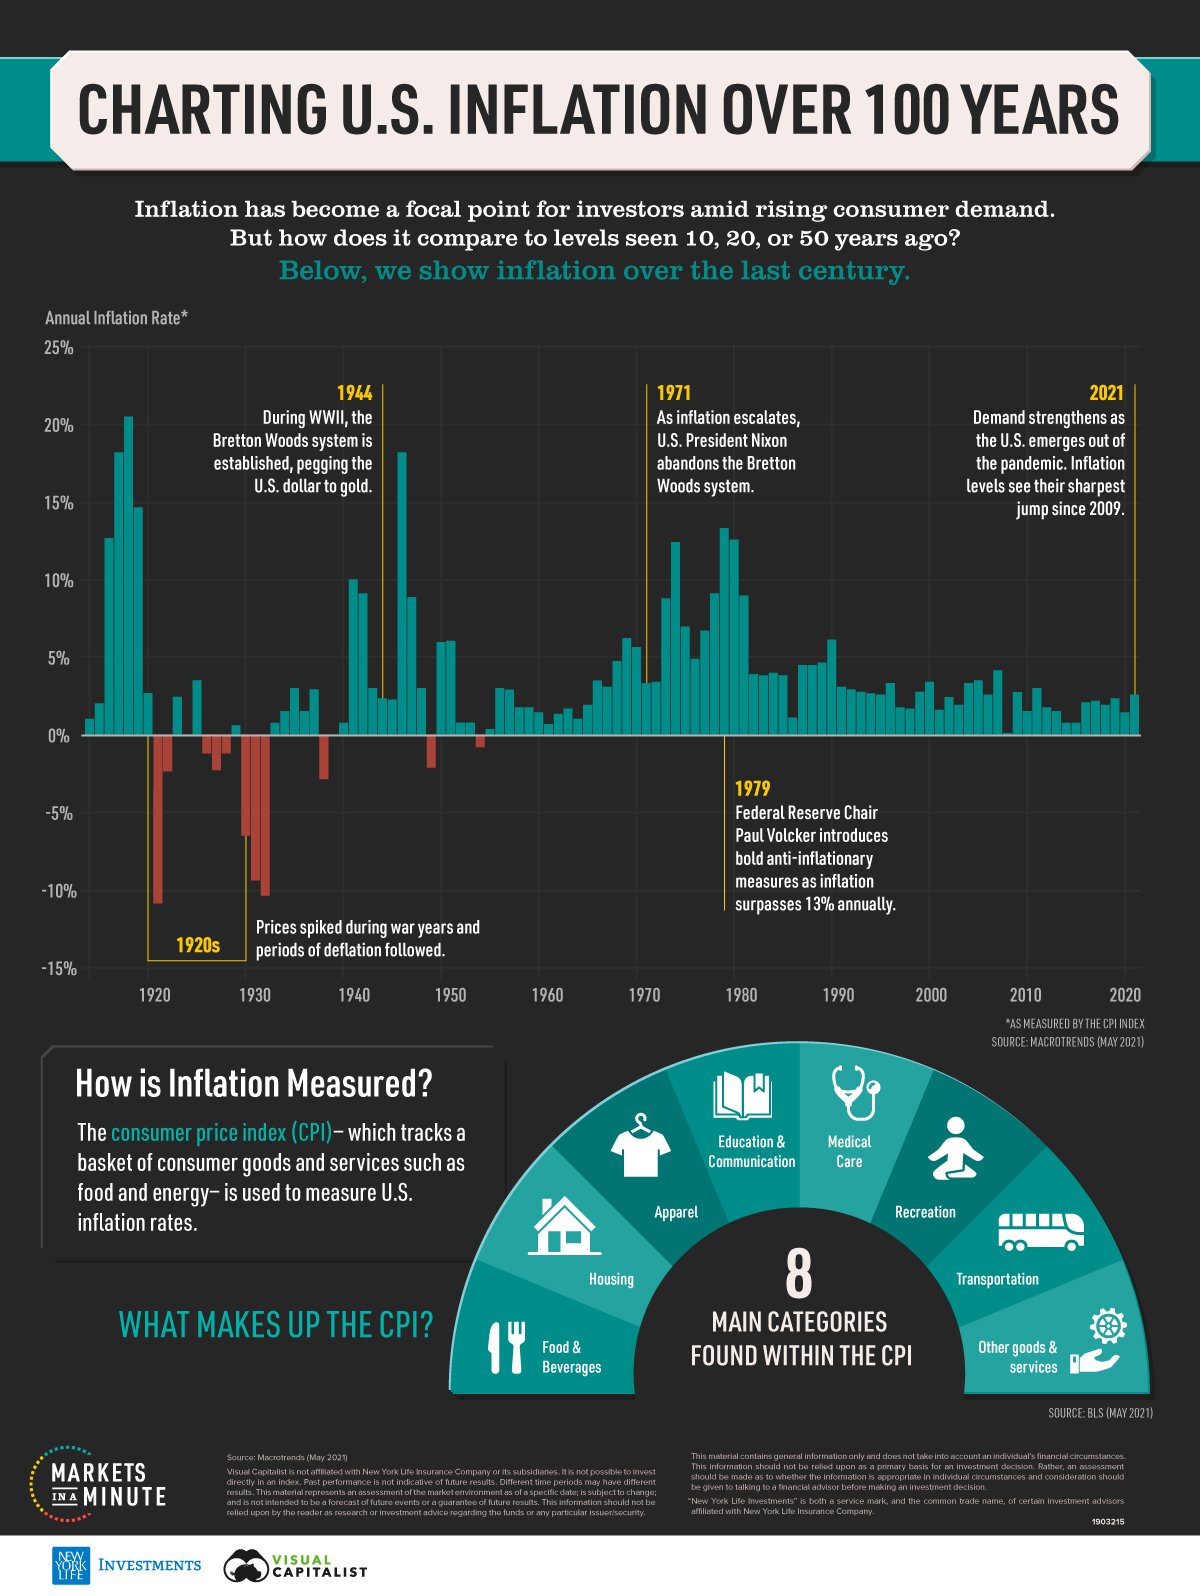
<a href=/climate-inflation-resources/howusinflationhaschangedover100years>The CPI tracks price changes for the same basket of goods and services, enabling us to understand how much the items we commonly purchase have become more expensive. This infographic illustrates US inflation over the past 100 years.</a>
<a href=/climate-inflation-resources/us-inflation-how-much-have-prices-increased>Have you experienced a jump in your ‘cost of living’ ? Find out what you’re paying more for now than 12 months ago. </a>
VIDEO GRAPHICS


